Tuesday, August 3, 2021


Spring Boot Autoscaling on Kubernetes


Autoscaling based on the custom metrics is one of the features that may convince you to run your Spring Boot application on Kubernetes. By default, horizontal pod autoscaling can scale the deployment based on the CPU and memory. However, such an approach is not enough for more advanced scenarios. In that case, you can use Prometheus to collect metrics from your applications. Then, you may integrate Prometheus with the Kubernetes custom metrics mechanism.

Preface

In this article, you will learn how to run Prometheus on Kubernetes using the Helm package manager. You will use the chart that causes Prometheus to scrape a variety of Kubernetes resource types. Thanks to that you won’t have to configure it. In the next step, you will install the Prometheus Adapter. You can also do that using the Helm package manager. The adapter acts as a bridge between the Prometheus instance and the custom metrics API. Our Spring Boot application exposes metrics through the HTTP endpoint. You will learn how to configure autoscaling on Kubernetes based on the number of incoming requests.

Source code

If you would like to try it by yourself, you may always take a look at my source code. In order to do that, you need to clone my repository sample-spring-boot-on-kubernetes. Then you should go to the k8s directory. You can find there all the Kubernetes manifests and configuration files required for that exercise.

Our Spring Boot application is ready to be deployed on Kubernetes with Skaffold. You can find the skaffold.yaml file in the project root directory. Skaffold uses Jib Maven Plugin for building a Docker image. It deploys not only the Spring Boot application but also the Mongo database.

apiVersion: skaffold/v2beta5
kind: Config
metadata:
  name: sample-spring-boot-on-kubernetes
build:
  artifacts:
    - image: piomin/sample-spring-boot-on-kubernetes
      jib:
        args:
          - -Pjib
  tagPolicy:
    gitCommit: {}
deploy:
  kubectl:
    manifests:
      - k8s/mongodb-deployment.yaml
      - k8s/deployment.yaml

The only thing you need to do to build and deploy the application is to execute the following command. It also allows you to access HTTP API through the local port.

$ skaffold dev --port-forward

For more information about Skaffold, Jib and a local development of Java applications, you may refer to the article Local Java Development on Kubernetes

Kubernetes Autoscaling with Spring Boot – Architecture

The picture visible below shows the architecture of our sample system. The horizontal pod autoscaler (HPA) automatically scales the number of pods based on CPU, memory, or other custom metrics. It obtains the value of the metric by pulling the Custom Metrics API. In the beginning, we are running a single instance of our Spring Boot application on Kubernetes. Prometheus gathers and stores metrics from the application by calling HTTP endpoint /actuator/promentheus. Consequently, the HPA scales up the number of pods if the value of the metric exceeds the assumed value.

spring-boot-autoscaler-on-kubernetes-arch

Run Prometheus on Kubernetes

Let’s start by running the Prometheus instance on Kubernetes. In order to do that, you should use the official Prometheus Helm chart. Firstly, you need to add the required repository.

$ helm repo add prometheus-community https://prometheus-community.github.io/helm-charts
$ helm repo add stable https://charts.helm.sh/stable
$ helm repo update

Then, you should execute the Helm install command and provide the name of your installation.

$ helm install prometheus prometheus-community/prometheus

In a moment, the Prometheus instance is ready to use. You can access it through the Kubernetes Service prometheus-server. It is available on port 443. By default, the type of service is ClusterIP. Therefore, you should execute the kubectl port-forward command to access it on the local port.

Deploy Spring Boot on Kubernetes

In order to enable Prometheus support in Spring Boot, you need to include Spring Boot Actuator and the Micrometer Prometheus library. The full list of required dependencies also contains the Spring Web and Spring Data MongoDB modules.

<dependency>
   <groupId>org.springframework.boot</groupId>
   <artifactId>spring-boot-starter-web</artifactId>
</dependency>
<dependency>
   <groupId>org.springframework.boot</groupId>
   <artifactId>spring-boot-starter-actuator</artifactId>
</dependency>
<dependency>
   <groupId>io.micrometer</groupId>
   <artifactId>micrometer-registry-prometheus</artifactId>
</dependency>
<dependency>
   <groupId>org.springframework.boot</groupId>
   <artifactId>spring-boot-devtools</artifactId>
</dependency>
<dependency>
   <groupId>org.springframework.boot</groupId>
   <artifactId>spring-boot-starter-data-mongodb</artifactId>
</dependency>

After enabling Prometheus support, the application exposes metrics through the /actuator/prometheus endpoint.

Our example application is very simple. It exposes the REST API for CRUD operations and connects to the Mongo database. Just to clarify, here’s the REST controller implementation.

@RestController
@RequestMapping("/persons")
public class PersonController {

   private PersonRepository repository;
   private PersonService service;

   PersonController(PersonRepository repository, PersonService service) {
      this.repository = repository;
      this.service = service;
   }

   @PostMapping
   public Person add(@RequestBody Person person) {
      return repository.save(person);
   }

   @PutMapping
   public Person update(@RequestBody Person person) {
      return repository.save(person);
   }

   @DeleteMapping("/{id}")
   public void delete(@PathVariable("id") String id) {
      repository.deleteById(id);
   }

   @GetMapping
   public Iterable<Person> findAll() {
      return repository.findAll();
   }

   @GetMapping("/{id}")
   public Optional<Person> findById(@PathVariable("id") String id) {
      return repository.findById(id);
   }

}

You may add a new person, modify and delete it through the HTTP API. You can also find it by id or just find all available persons. The Spring Boot Actuator generates HTTP traffic statistics per each endpoint and exposes it in the form readable by Prometheus. The number of incoming requests is available in the http_server_requests_seconds_count metric. Consequently, we will use this metric for Spring Boot autoscaling on Kubernetes.

Prometheus collects a pretty large set of metrics from the whole cluster. However, by default, it is not gathering the logs from applications. In order to force Prometheus to scrape the particular pods, you must add annotations to the Deployment as shown below. The annotation prometheus.io/path indicates the context path with the metrics endpoint. Of course, you have to enable scraping for the application using the annotation prometheus.io/scrape. Finally, you need to set the number of HTTP port with prometheus.io/port.

apiVersion: apps/v1
kind: Deployment
metadata:
  name: sample-spring-boot-on-kubernetes-deployment
spec:
  selector:
    matchLabels:
      app: sample-spring-boot-on-kubernetes
  template:
    metadata:
      annotations:
        prometheus.io/path: /actuator/prometheus
        prometheus.io/scrape: "true"
        prometheus.io/port: "8080"
      labels:
        app: sample-spring-boot-on-kubernetes
    spec:
      containers:
      - name: sample-spring-boot-on-kubernetes
        image: piomin/sample-spring-boot-on-kubernetes
        ports:
        - containerPort: 8080
        env:
          - name: MONGO_DATABASE
            valueFrom:
              configMapKeyRef:
                name: mongodb
                key: database-name
          - name: MONGO_USERNAME
            valueFrom:
              secretKeyRef:
                name: mongodb
                key: database-user
          - name: MONGO_PASSWORD
            valueFrom:
              secretKeyRef:
                name: mongodb
                key: database-password

Install Prometheus Adapter on Kubernetes

The Prometheus adapter pulls metrics from the Prometheus instance and exposes them as the Custom Metrics API. In this step, you will have to provide configuration for pulling a custom metric exposed by the Spring Boot Actuator. The http_server_requests_seconds_count metric contains a number of requests received by the particular HTTP endpoint. To clarify, let’s take a look at the list of http_server_requests_seconds_count metrics for the multiple /persons endpoints.

You need to override some configuration settings for the Prometheus adapter. Firstly, you should change the default address of the Prometheus instance. Since the name of the Prometheus Service is prometheus-server, you should change it to prometheus-server.default.svc. The number of HTTP port is 80. Then, you have to define a custom rule for pulling the required metric from Prometheus. It is important to override the name of the Kubernetes pod and namespace used as a metric tag by Prometheus. There are multiple entries for http_server_requests_seconds_count, so you must calculate the sum. The name of the custom Kubernetes metric is http_server_requests_seconds_count_sum.

prometheus:
  url: http://prometheus-server.default.svc
  port: 80
  path: ""

rules:
  default: true
  custom:
  - seriesQuery: '{__name__=~"^http_server_requests_seconds_.*"}'
    resources:
      overrides:
        kubernetes_namespace:
          resource: namespace
        kubernetes_pod_name:
          resource: pod
    name:
      matches: "^http_server_requests_seconds_count(.*)"
      as: "http_server_requests_seconds_count_sum"
    metricsQuery: sum(<<.Series>>{<<.LabelMatchers>>,uri=~"/persons.*"}) by (<<.GroupBy>>)

Now, you just need to execute the Helm install command with the location of the YAML configuration file.

$ helm install -f k8s\helm-config.yaml prometheus-adapter prometheus-community/prometheus-adapter

Finally, you can verify if metrics have been successfully pulled by executing the following command.

Create Kubernetes Horizontal Pod Autoscaler

In the last step of this tutorial, you will create a Kubernetes HorizontalPodAutoscalerHorizontalPodAutoscaler automatically scales up the number of pods if the average value of the http_server_requests_seconds_count_sum metric exceeds 100. In other words, if your instance of application receives more than 100 requests, HPA automatically runs a new instance. Then, after sending another 100 requests, an average value of metric exceeds 100 once again. So, HPA runs a third instance of the application. Consequently, after sending 1k requests you should have 10 pods. The definition of our HorizontalPodAutoscaler is visible below.

apiVersion: autoscaling/v2beta2
kind: HorizontalPodAutoscaler
metadata:
  name: sample-hpa
  namespace: default
spec:
  scaleTargetRef:
    apiVersion: apps/v1
    kind: Deployment
    name: sample-spring-boot-on-kubernetes-deployment
  minReplicas: 1
  maxReplicas: 10
  metrics:
    - type: Pods
      pods:
        metric:
          name: http_server_requests_seconds_count_sum
        target:
          type: AverageValue
          averageValue: 100

Testing Kubernetes autoscaling with Spring Boot

After deploying all the required components you may verify a list of running pods. As you see, there is a single instance of our Spring Boot application sample-spring-boot-on-kubernetes.

In order to check the current value of the http_server_requests_seconds_count_sum metric you can display the details about HorizontalPodAutoscaler. As you see I have already sent 15 requests to the different HTTP endpoints.

spring-boot-autoscaling-on-kubernetes-hpa

Here’s the sequence of requests you may send to the application to test autoscaling behavior.

$ curl http://localhost:8080/persons -d "{\"firstName\":\"Test\",\"lastName\":\"Test\",\"age\":20,\"gender\":\"MALE\"}" -H "Content-Type: application/
json"
{"id":"5fa334d149685f24841605a9","firstName":"Test","lastName":"Test","age":20,"gender":"MALE"}
$ curl http://localhost:8080/persons/5fa334d149685f24841605a9
{"id":"5fa334d149685f24841605a9","firstName":"Test","lastName":"Test","age":20,"gender":"MALE"}
$ curl http://localhost:8080/persons
[{"id":"5fa334d149685f24841605a9","firstName":"Test","lastName":"Test","age":20,"gender":"MALE"}]
$ curl -X DELETE http://localhost:8080/persons/5fa334d149685f24841605a9

After sending many HTTP requests to our application, you may verify the number of running pods. In that case, we have 5 instances.

spring-boot-autoscaling-on-kubernetes-hpa-finish

You can also display a list of running pods.

Conclusion

In this article, I showed you a simple scenario of Kubernetes autoscaling with Spring Boot based on the number of incoming requests. You may easily create more advanced scenarios just by modifying a metric query in the Prometheus Adapter configuration file. I run all my tests on Google Cloud with GKE. For more information about running JVM applications on GKE please refer to Running Kotlin Microservice on Goggle Kubernetes Engine.
Monday, August 2, 2021


Dockerizing Multi-maven project with docker-compose.yml

I have a problem with a docker-compose on my maven-multi project. My module won't start up on docker and the container throws an exception:

Exception in thread "main" java.lang.NoClassDefFoundError:

my parent pom:

<?xml version="1.0" encoding="UTF-8"?>
<project xmlns="http://maven.apache.org/POM/4.0.0"
         xmlns:xsi="http://www.w3.org/2001/XMLSchema-instance"
         xsi:schemaLocation="http://maven.apache.org/POM/4.0.0 http://maven.apache.org/xsd/maven-4.0.0.xsd">
    <modelVersion>4.0.0</modelVersion>
    <groupId>org.example.com</groupId>
    <artifactId>derived-markets</artifactId>
    <version>1.0-SNAPSHOT</version>
    <packaging>pom</packaging>

    <parent>
        <groupId>org.example.com</groupId>
        <artifactId>spring-boot-starter-parent</artifactId>
        <version>2.3.9.RELEASE</version>
    </parent>

    <properties>
        <java.version>11</java.version>
        <lombok.version>1.18.12</lombok.version>
        <maven.compiler.source>1.8</maven.compiler.source>
        <maven.compiler.target>1.8</maven.compiler.target>
        <project.build.sourceEncoding>UTF-8</project.build.sourceEncoding>
        <spring-boot.repackage.skip>true</spring-boot.repackage.skip>
    </properties>

    <modules>
        <module>model</module>
        <module>saver-module</module>
        <module>testing-tool-module</module>
    </modules>


    <dependencies>

        <dependency>
            <groupId>org.projectlombok</groupId>
            <artifactId>lombok</artifactId>
            <version>${lombok.version}</version>
            <scope>provided</scope>
        </dependency>


    </dependencies>
    <dependencyManagement>
        <dependencies>

            <dependency>
                <groupId>mysql</groupId>
                <artifactId>mysql-connector-java</artifactId>
                <version>8.0.23</version>
            </dependency>

            <dependency>
                <groupId>com.fasterxml.jackson.core</groupId>
                <artifactId>jackson-annotations</artifactId>
                <version>2.12.3</version>
            </dependency>


        </dependencies>
    </dependencyManagement>
</project>

this is my module pom:

<?xml version="1.0" encoding="UTF-8"?>
<project xmlns="http://maven.apache.org/POM/4.0.0" xmlns:xsi="http://www.w3.org/2001/XMLSchema-instance"
         xsi:schemaLocation="http://maven.apache.org/POM/4.0.0 https://maven.apache.org/xsd/maven-4.0.0.xsd">
    <modelVersion>4.0.0</modelVersion>

    <parent>
        <groupId>org.example.com</groupId>
        <artifactId>derived-markets</artifactId>
        <version>1.0-SNAPSHOT</version>
    </parent>

    <artifactId>saver-module</artifactId>
    <name>saver-module</name>
    <description>Database saver</description>
    <packaging>jar</packaging>

    <dependencies>

        <dependency>
            <groupId>org.mybatis</groupId>
            <artifactId>mybatis</artifactId>
            <version>3.5.6</version>
        </dependency>

        <dependency>
            <groupId>org.springframework.boot</groupId>
            <artifactId>spring-boot-starter-web</artifactId>
        </dependency>

        <dependency>
            <groupId>org.springframework.amqp</groupId>
            <artifactId>spring-rabbit</artifactId>
        </dependency>

        <dependency>
            <groupId>mysql</groupId>
            <artifactId>mysql-connector-java</artifactId>
            <version>8.0.23</version>
        </dependency>

        <dependency>
            <groupId>org.springframework.boot</groupId>
            <artifactId>spring-boot-starter-actuator</artifactId>
        </dependency>

        <dependency>
            <groupIdorg.example.com</groupId>
            <artifactId>model</artifactId>
            <version>1.0-SNAPSHOT</version>
        </dependency>

    </dependencies>

    <build>

        <plugins>
            <plugin>
                <groupId>org.springframework.boot</groupId>
                <artifactId>spring-boot-maven-plugin</artifactId>
            </plugin>
            <plugin>
                <!-- Build an executable JAR -->
                <groupId>org.apache.maven.plugins</groupId>
                <artifactId>maven-jar-plugin</artifactId>
                <version>3.1.0</version>
                <configuration>
                    <archive>
                        <manifest>
                            <mainClass>org.example.com.SaverModuleApplication</mainClass>
                        </manifest>
                    </archive>
                </configuration>
            </plugin>
        </plugins>

        <finalName>saver-module</finalName>

    </build>

</project>

my docker-compose.yml is like this:

version: "3"
services:
  saver:
    build:
      context: ./saver-module
      dockerfile: Dockerfile
    ports:
      - "8090:8090"

and actually its dockerfile inside the module:

FROM maven:3.6.0-jdk-11-slim AS build
ADD src /derived2/saver-module/src
ADD pom.xml /derived2/saver-module
RUN mvn -f /derived2/saver-module/pom.xml clean install

FROM openjdk:latest
ADD target/saver-module.jar /saver-module.jar
EXPOSE 8090
CMD ["java", "-jar", "saver-module.jar"]


What is SQL injection

SQL injection, also known as SQLI, is a common attack vector that uses malicious SQL code for backend database manipulation to access information that was not intended to be displayed. This information may include any number of items, including sensitive company data, user lists or private customer details.

The impact SQL injection can have on a business is far-reaching. A successful attack may result in the unauthorized viewing of user lists, the deletion of entire tables and, in certain cases, the attacker gaining administrative rights to a database, all of which are highly detrimental to a business.

When calculating the potential cost of an SQLi, it’s important to consider the loss of customer trust should personal information such as phone numbers, addresses, and credit card details be stolen.

While this vector can be used to attack any SQL database, websites are the most frequent targets.

What are SQL queries

SQL is a standardized language used to access and manipulate databases to build customizable data views for each user. SQL queries are used to execute commands, such as data retrieval, updates, and record removal. Different SQL elements implement these tasks, e.g., queries using the SELECT statement to retrieve data, based on user-provided parameters.

A typical eStore’s SQL database query may look like the following:

SELECT ItemName, ItemDescription
FROM Item
WHERE ItemNumber = ItemNumber

From this, the web application builds a string query that is sent to the database as a single SQL statement:

sql_query= "
SELECT ItemName, ItemDescription
FROM Item
WHERE ItemNumber = " & Request.QueryString("ItemID")

A user-provided input http://www.estore.com/items/items.asp?itemid=999 can then generates the following SQL query:

SELECT ItemName, ItemDescription
FROM Item
WHERE ItemNumber = 999

As you can gather from the syntax, this query provides the name and description for item number 999.

Types of SQL Injections

SQL injections typically fall under three categories: In-band SQLi (Classic), Inferential SQLi (Blind) and Out-of-band SQLi. You can classify SQL injections types based on the methods they use to access backend data and their damage potential.

In-band SQLi

The attacker uses the same channel of communication to launch their attacks and to gather their results. In-band SQLi’s simplicity and efficiency make it one of the most common types of SQLi attack. There are two sub-variations of this method:

  • Error-based SQLi—the attacker performs actions that cause the database to produce error messages. The attacker can potentially use the data provided by these error messages to gather information about the structure of the database.
  • Union-based SQLi—this technique takes advantage of the UNION SQL operator, which fuses multiple select statements generated by the database to get a single HTTP response. This response may contain data that can be leveraged by the attacker.

Inferential (Blind) SQLi

The attacker sends data payloads to the server and observes the response and behavior of the server to learn more about its structure. This method is called blind SQLi because the data is not transferred from the website database to the attacker, thus the attacker cannot see information about the attack in-band.

Blind SQL injections rely on the response and behavioral patterns of the server so they are typically slower to execute but may be just as harmful. Blind SQL injections can be classified as follows:

  • Boolean—that attacker sends a SQL query to the database prompting the application to return a result. The result will vary depending on whether the query is true or false. Based on the result, the information within the HTTP response will modify or stay unchanged. The attacker can then work out if the message generated a true or false result.
  • Time-based—attacker sends a SQL query to the database, which makes the database wait (for a period in seconds) before it can react. The attacker can see from the time the database takes to respond, whether a query is true or false. Based on the result, an HTTP response will be generated instantly or after a waiting period. The attacker can thus work out if the message they used returned true or false, without relying on data from the database.

Out-of-band SQLi

The attacker can only carry out this form of attack when certain features are enabled on the database server used by the web application. This form of attack is primarily used as an alternative to the in-band and inferential SQLi techniques.

Out-of-band SQLi is performed when the attacker can’t use the same channel to launch the attack and gather information, or when a server is too slow or unstable for these actions to be performed. These techniques count on the capacity of the server to create DNS or HTTP requests to transfer data to an attacker.

SQL injection example

An attacker wishing to execute SQL injection manipulates a standard SQL query to exploit non-validated input vulnerabilities in a database. There are many ways that this attack vector can be executed, several of which will be shown here to provide you with a general idea about how SQLI works.

For example, the above-mentioned input, which pulls information for a specific product, can be altered to read http://www.estore.com/items/items.asp?itemid=999 or 1=1.

As a result, the corresponding SQL query looks like this:

SELECT ItemName, ItemDescription
FROM Items
WHERE ItemNumber = 999 OR 1=1

And since the statement 1 = 1 is always true, the query returns all of the product names and descriptions in the database, even those that you may not be eligible to access.

Attackers are also able to take advantage of incorrectly filtered characters to alter SQL commands, including using a semicolon to separate two fields.

For example, this input http://www.estore.com/items/iteams.asp?itemid=999; DROP TABLE Users would generate the following SQL query:

SELECT ItemName, ItemDescription
FROM Items
WHERE ItemNumber = 999; DROP TABLE USERS

As a result, the entire user database could be deleted.

Another way SQL queries can be manipulated is with a UNION SELECT statement. This combines two unrelated SELECT queries to retrieve data from different database tables.

For example, the input http://www.estore.com/items/items.asp?itemid=999 UNION SELECT user-name, password FROM USERS produces the following SQL query:

SELECT ItemName, ItemDescription
FROM Items
WHERE ItemID = '999' UNION SELECT Username, Password FROM Users;

Using the UNION SELECT statement, this query combines the request for item 999’s name and description with another that pulls names and passwords for every user in the database.

SQL injection combined with OS Command Execution: The Accellion Attack

Accellion, maker of File Transfer Appliance (FTA), a network device widely deployed in organizations around the world, and used to move large, sensitive files. The product is over 20 years old and is now at end of life.

FTA was the subject of a unique, highly sophisticated attack combining SQL injection with operating system command execution. Experts speculate the Accellion attack was carried out by hackers with connections to the financial crimes group FIN11, and ransomware group Clop.

The attack demonstrates that SQL injection is not just an attack that affects web applications or web services, but can also be used to compromise back-end systems and exfiltrate data.

Who was affected by the attack?

The Accellion exploit is a supply chain attack, affecting numerous organizations that had deployed the FTA device. These included the Reserve Bank of New Zealand, the State of Washington, the Australian Securities and Investments Commission, telecommunication giant Singtel, and security software maker Qualys, as well as numerous others.

Accelion Attack flow

According to a report commissioned by Accellion, the combination SQLi and command execution attack worked as follows:

  1. Attackers performed SQL Injection to gain access to document_root.html, and retrieved encryption keys from the Accellion FTA database.
  2. Attackers used the keys to generate valid tokens, and used these tokens to gain access to additional files
  3. Attackers exploited an operating system command execution flaw in the sftp_account_edit.php file, allowing them to execute their own commands
  4. Attackers created a web shell in the server path /home/seos/courier/oauth.api
  5. Using this web shell, they uploaded a custom, full-featured web shell to disk, which included highly customized tooling for exfiltration of data from the Accellion system. The researchers named this shell DEWMODE.
  6. Using DEWMODE, the attackers extracted a list of available files from a MySQL database on the Accellion FTA system, and listed files and their metadata on an HTML page
  7. The attackers performed file download requests, which contained requests to the DEWMODE component, with encrypted and encoded URL parameters.
  8. DEWMODE is able to accept these requests and then delete the download requests from the FTA web logs.

This raises the profile of SQL injection attacks, showing how they can be used as a gateway for a much more damaging attack on critical corporate infrastructure.

SQLI prevention and mitigation

There are several effective ways to prevent SQLI attacks from taking place, as well as protecting against them, should they occur.

The first step is input validation (a.k.a. sanitization), which is the practice of writing code that can identify illegitimate user inputs.

While input validation should always be considered best practice, it is rarely a foolproof solution. The reality is that, in most cases, it is simply not feasible to map out all legal and illegal inputs—at least not without causing a large number of false positives, which interfere with user experience and an application’s functionality.

For this reason, a web application firewall (WAF) is commonly employed to filter out SQLI, as well as other online threats. To do so, a WAF typically relies on a large, and constantly updated, list of meticulously crafted signatures that allow it to surgically weed out malicious SQL queries. Usually, such a list holds signatures to address specific attack vectors and is regularly patched to introduce blocking rules for newly discovered vulnerabilities.

Modern web application firewalls are also often integrated with other security solutions. From these, a WAF can receive additional information that further augments its security capabilities.

For example, a web application firewall that encounters a suspicious, but not outright malicious input may cross-verify it with IP data before deciding to block the request. It only blocks the input if the IP itself has a bad reputational history.

Imperva cloud-based WAF uses signature recognition, IP reputation, and other security methodologies to identify and block SQL injections, with a minimal amount of false positives. The WAF’s capabilities are augmented by IncapRules—a custom security rule engine that enables granular customization of default security settings and the creation of additional case-specific security policies.

Our WAF also employs crowdsourcing techniques that ensure that new threats targeting any user are immediately propagated across the entire user-base. This enables rapid response to newly disclosed vulnerability and zero-day threats.

See how Imperva Web Application Firewall can help you with SQL injections.

Adding Data-Centric Protection for Defense in Depth

The optimal defense is a layered approach that includes data-centric strategies that focus on protecting the data itself, as well as the network and applications around it. Imperva Database Security continuously discovers and classifies sensitive data to identify how much sensitive data there is, where it is stored, and whether it’s protected.

In addition, Imperva Database Security actively monitors data access activity to identify any data access behavior that is a risk or violates policy, regardless of whether it originates with a network SQL query, a compromised user account, or a malicious insider. Receive automatic notification of a security event so you can respond quickly with security analytics that provides a clear explanation of the threat and enables immediate initiation of the response process, all from a single platform.

Database security is a critical last line of defense to preventing hacks like SQLi. Imperva’s unique approach to protecting data encompasses a complete view of both the web application and data layer.

Sunday, August 1, 2021


Containerizing Maven/Gradle based Multi Module Spring Boot Microservices using Docker & Kubernetes

Clone the source code of the article from mavengradle-based-multi-module-spring-boot-microservices

Introduction

This article is about bootstrapping Maven / Gradle multi-module Spring Boot Microservices and have them deployed using Docker Compose & Kubernetes.

Most of the articles around the web try to define a single Spring Boot application and provide steps on dockerizing and have them deployed to Docker Compose or Kubernetes. This article focuses on filling the gaps for implementing and deploying multi-module interdependent microservices, which could be base for any similar usecase.

Usecase

We shall look into implementing a simple usecase which can help us understand the core concepts around configuring multi-module project with Maven & Gradle and the commands to build and create docker images. This is further extended with steps on having these microservices deployed with Docker Compose & Kubernetes.

Below is the use case we shall go through in this article. This includes three Spring Boot application exposing RESTFul endpoint and one of them being the root application and the other two being downstream applications.

Service A
Service B
Service C

Rather than providing detailed explanation on the underlying concepts around Spring Boot (YAML configuration, Spring Profiles, Docker, Kubernetes), We shall only focus on configurations and commands to execute to have the three applications built and deployed successfully.

Technology stack for implementing the Restful APIs...

Bootstrapping Project with Spring Initializr

Spring Initializr generates spring boot project with just what we need to start implementing Restful services quickly. Initialize the project with appropriate details and the below dependencies.

  • Spring Web
  • Spring Boot DevTools

Click Here to download maven / gradle project with the above dependencies.

This step is to bootstrap the project with necessary folder structure and dependencies. We shall use this as a base for defining the multi-module application with the root project and its child modules.

Project directory Structure

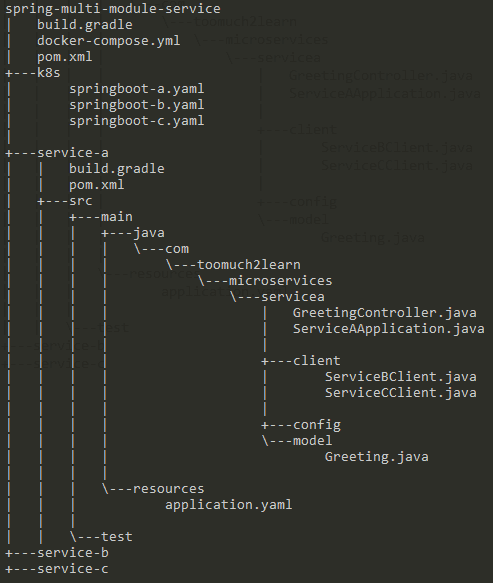
Below is the directory structure for the root project and the individual child modules for each of the spring boot application

"Project directory structure"
Project directory structure

Below are the three Spring Boot RESTful applications exposing greeting endpoint.

  • Service B & Service C are independent services running separately and responding with a greeting message when accessed.
  • Service A consumes Service B and Service C. Greeting messages responded by the downstream APIs is concatenated to the greeting message from Service A.

Multi Module Spring Boot applications with Maven

For Maven, we need to configure multi module projects with <modules> in Root Projects pom.xml. Modules rely upon dependencies and plugins that are configured within the root project. So its ideal to configure all dependencies and plugins within root pom.xml such that module’s pom.xml will be minimal with only specific dependencies they rely upon.

Below is the pom.xml for Root Project with all three modules registered under <modules>.

Root Project - pom.xml
<?xml version="1.0" encoding="UTF-8"?>
<project xmlns="http://maven.apache.org/POM/4.0.0" xmlns:xsi="http://www.w3.org/2001/XMLSchema-instance"
         xsi:schemaLocation="http://maven.apache.org/POM/4.0.0 http://maven.apache.org/xsd/maven-4.0.0.xsd">
    <modelVersion>4.0.0</modelVersion>
    <groupId>com.toomuch2learn.microservices</groupId>
	<artifactId>spring-multi-module-service</artifactId>
	<version>0.0.1-SNAPSHOT</version>
	<name>spring-multi-module-service</name>
	<description>Spring multi module service</description>
    <packaging>pom</packaging>

    <parent>		<groupId>org.springframework.boot</groupId>		<artifactId>spring-boot-starter-parent</artifactId>		<version>2.4.1</version>		<relativePath/> <!-- lookup parent from repository -->	</parent>
    <modules>        <module>service-a</module>             <module>service-b</module>             <module>service-c</module>    </modules>
    <properties>
		<java.version>11</java.version>
		<spring-cloud.version>2020.0.0</spring-cloud.version>
	</properties>

    <dependencies>
        <dependency>
			<groupId>org.yaml</groupId>
			<artifactId>snakeyaml</artifactId>
			<version>1.27</version>
		</dependency>

		<dependency>
			<groupId>org.springframework.boot</groupId>
			<artifactId>spring-boot-starter-web</artifactId>
		</dependency>

		<dependency>
			<groupId>org.springframework.boot</groupId>
			<artifactId>spring-boot-devtools</artifactId>
			<scope>runtime</scope>
			<optional>true</optional>
		</dependency>

    <dependency>
			<groupId>org.springframework.boot</groupId>
			<artifactId>spring-boot-starter-test</artifactId>
			<scope>test</scope>
		</dependency>

	</dependencies>

  <dependencyManagement>
		<dependencies>
			<dependency>
				<groupId>org.springframework.cloud</groupId>
				<artifactId>spring-cloud-dependencies</artifactId>
				<version>${spring-cloud.version}</version>
				<type>pom</type>
				<scope>import</scope>
			</dependency>
		</dependencies>
	</dependencyManagement>

	<build>
		<plugins>
			<plugin>
				<groupId>org.springframework.boot</groupId>
				<artifactId>spring-boot-maven-plugin</artifactId>
			</plugin>
		</plugins>
	</build>

	<repositories>
		<repository>
			<id>spring-milestones</id>
			<name>Spring Milestones</name>
			<url>https://repo.spring.io/milestone</url>
		</repository>
	</repositories>
  
</project>

As per the usecase, Service A consumes Service B and Service C using Feign Http Client and thus this dependency is included in Service A pom.xml rather than in Root pom.xml.

Service A - pom.xml
<?xml version="1.0" encoding="UTF-8"?>
<project xmlns="http://maven.apache.org/POM/4.0.0" xmlns:xsi="http://www.w3.org/2001/XMLSchema-instance"
	xsi:schemaLocation="http://maven.apache.org/POM/4.0.0 https://maven.apache.org/xsd/maven-4.0.0.xsd">
	<modelVersion>4.0.0</modelVersion>
	
	<parent>
		<groupId>com.toomuch2learn.microservices</groupId>
		<artifactId>spring-multi-module-service</artifactId>
		<version>0.0.1-SNAPSHOT</version>
	</parent>
	
	<artifactId>service-a</artifactId>	<name>service-a</name>	<description>Service A</description>
	<properties>
		<java.version>11</java.version>
		<spring-boot.build-image.imageName>$DOCKER_USER_NAME$/${parent.artifactId}-${project.artifactId}</spring-boot.build-image.imageName>
	</properties>

	<dependencies>		<dependency>			<groupId>org.springframework.cloud</groupId>			<artifactId>spring-cloud-starter-openfeign</artifactId>		</dependency>		</dependencies>
</project>

Apart from project specific meta data, pom.xml remains the same for both Service B & Service C.

Service B - pom.xml
<?xml version="1.0" encoding="UTF-8"?>
<project xmlns="http://maven.apache.org/POM/4.0.0" xmlns:xsi="http://www.w3.org/2001/XMLSchema-instance"
	xsi:schemaLocation="http://maven.apache.org/POM/4.0.0 https://maven.apache.org/xsd/maven-4.0.0.xsd">
	<modelVersion>4.0.0</modelVersion>
	
	<parent>
		<groupId>com.toomuch2learn.microservices</groupId>
		<artifactId>spring-multi-module-service</artifactId>
		<version>0.0.1-SNAPSHOT</version>
	</parent>
	
	<artifactId>service-b</artifactId>	<name>service-b</name>	<description>Service B</description>
	<properties>
		<java.version>11</java.version>
		<spring-boot.build-image.imageName>$DOCKER_USER_NAME$/${parent.artifactId}-${project.artifactId}</spring-boot.build-image.imageName>
	</properties>

	<dependencies>		
	</dependencies>

</project>

Maven commands to execute to build, package and create docker images for the Spring Boot modules.

List all modules under maven project
$ mvn help:evaluate -Dexpression=project.modules
Build and create docker images for all modules from parent
$ mvn clean package spring-boot:build-image
Execute maven goal on specific module from parent
$ mvn clean spring-boot:run -pl service-a

$ mvn clean package spring-boot:build-image -pl service-a

Multi Module Spring Boot applications with Gradle

For Gradle, we need to include multi module projects in settings.gradle in Root Projects. Modules rely upon dependencies and plugins that are configured within the root project. So its ideal to configure all dependencies and plugins within root build.gradle such that module’s build.gradle will be minimal with only specific dependencies they rely upon.

Below is setting.gradle for Root Project with all three modules registered with include.

setting.gradle
rootProject.name = 'spring-multi-module-service'

include 'service-a'include 'service-b'include 'service-c'
Root Project - build.gradle
plugins {
	id 'org.springframework.boot' version '2.4.1'
	id 'io.spring.dependency-management' version '1.0.10.RELEASE'
	id 'java'
}

repositories {
	mavenCentral()
	maven { url 'https://repo.spring.io/milestone' }
}

ext {
	set('springCloudVersion', "2020.0.0")
}

allprojects {
	group = 'com.toomuch2learn.microservices'
	version = '0.0.1-SNAPSHOT'
	sourceCompatibility = '11'
}

subprojects {

	apply plugin: 'org.springframework.boot'
	apply plugin: 'io.spring.dependency-management'
	apply plugin: 'java'

	repositories {
		mavenCentral()
	}

	test {
		useJUnitPlatform()
	}

	dependencies {
		implementation 'org.yaml:snakeyaml:1.27'
		implementation 'org.springframework.boot:spring-boot-starter-web'
		developmentOnly 'org.springframework.boot:spring-boot-devtools'
		testImplementation 'org.springframework.boot:spring-boot-starter-test'
	}

	dependencyManagement {
		imports {
			mavenBom "org.springframework.cloud:spring-cloud-dependencies:${springCloudVersion}"
		}
	}
}

bootJar {
	enabled = false
}

bootBuildImage{
	enabled = false
}

As per the usecase, Service A consumes Service B and Service C using Feign Http Client and thus this dependency is included in Service A build.gradle rather than in Root build.gradle.

Service A - build.gradle
dependencies {  implementation 'org.springframework.cloud:spring-cloud-starter-openfeign'}
bootJar {
	enabled = true
}

bootBuildImage{ 
  imageName='$DOCKER_USER_NAME$/'+rootProject.name+'-'+project.name
}

Apart from project specific meta data, build.gradle remains the same for both Service B & Service C.

Service B - build.gradle
dependencies {}
bootJar {
	enabled = true
}

bootBuildImage{ 
  imageName='$DOCKER_USER_NAME$/'+rootProject.name+'-'+project.name
}

Gradle commands to execute to build, package and create docker images for the Spring Boot modules.

List all projects under gradle project
$ gradle -q projects
Build and create docker images for all project from parent
$ gradle clean build bootBuildImage
Execute gradle task on specific project from parent
$ gradle clean :service-a:bootRun

$ gradle clean :service-a:build :service-a:bootBuildImage

Working with Spring Profiles

One of the core features with Spring Framework is the support for Profiles. It allows us to configure environment specific properties and choose the appropriate profile based on the environment the service is deployed to.

Below is application.yaml for Service A which shows profiles dev and prod configured with dev being the default. Each profile is separated with --- in yaml file.

Service A application.yaml
spring:
  application:
    name: service-a
  profiles:    active: "dev"
---

spring:
  profiles: devserver:
  port : 8081

serviceb:
  url: http://localhost:8082

servicec:
  url: http://localhost:8083

---

spring:
  profiles: prodserver:
  port : 8080

Set spring.profiles.active to choose the appropriate profile to be used when starting the service.

Testing APIs via cURL

Start services using java and test services using curl command.

Start services using Java by running fat jar
$ java -jar service-a\target\service-a-0.0.1-SNAPSHOT.jar

$ java -jar service-b\target\service-b-0.0.1-SNAPSHOT.jar

$ java -jar service-b\target\service-c-0.0.1-SNAPSHOT.jar

Use the below cURLs to invoke the services. Observe the response from Service A which includes the concatenated message from Service B and Service C.

Access RESTful endpoint using cURL
$ curl http://localhost:8081/greeting

$ curl http://localhost:8082/greeting

$ curl http://localhost:8083/greeting

Below is the output that should display upon accessing Service AService B & Service C using cURL. Observe the response from Service A with concatenated message from Service B and Service C

"Response output from cURL call"
Response output from cURL call

Working with Docker Images

Either with Maven or Gradle, Docker Images created by Spring Boot DevTools plugin remain’s the same.

Below are the images that are created.

"Docker Images created by Spring Boot DevTools"
Docker Images created by Spring Boot DevTools

Execute the below commands to list the docker images, start the containers and test the services.

List Docker images
$ docker images | grep spring-multi-module

Start the containers individually. Observe passing spring.profiles.active environment variable to set prod profile during startup.

Also, observe the docker run command for service-a. To access downstream APIs, serviceb.url and servicec.url is passed explicitly for Service A to call Service B & Service C.

Run docker images
$ docker run -d -p 8081:8080 -e spring.profiles.active=prod -e serviceb.url=http://<HOST_IP>:8082 -e servicec.url=http://<HOST_IP>:8083 $DOCKER_USER_NAME$/spring-multi-module-service-service-a

$ docker run -d -p 8082:8080 -e spring.profiles.active=prod $DOCKER_USER_NAME$/spring-multi-module-service-service-b

$ docker run -d -p 8083:8080 -e spring.profiles.active=prod $DOCKER_USER_NAME$/spring-multi-module-service-service-c
List containers currently running
$ docker ps
Stop running container
$ docker stop <CONTAINER_ID>
List all containers that are running or stopped
$ docker ps -a
Start a container which is not running
$ docker start <CONTAINER_ID>
Delete docker container
$ docker rm <CONTAINER_ID>
Delete docker image
$ docker rmi <IMAGE_ID>
One liner to stop all running containers
$ docker stop $(docker ps -a -q)
One liner to remove all stopped containers
$ docker rm $(docker ps -a -q)

Pushing docker images to Docker Hub

Follow the below steps to tag the images and push them to Docker Hub.

Ensure to login to Docker
$ docker login
Tag docker image before pushing to docker hub if image name is not tagged with docker hub username
$ docker tab <IMAGE_ID> <Docker_Username>/<IMAGE_NAME>

$  docker tag ffc5ec760103 $DOCKER_USER_NAME$/springboot-servicea
Push to docker hub
$ docker push <Docker_Username>/<IMAGE_NAME>

$ docker push $DOCKER_USER_NAME$/spring-multi-module-service-service-a

Deploying with Docker Compose

Instead of running docker images individually, the whole stack can be brought up / down with docker-compose.

Below is docker-compose.yaml with all the services configured individually.

docker-compose.yaml
version: '3.9'

# Define services
services:

  # Service A
  service-a:
    image: $DOCKER_USER_NAME$/spring-multi-module-service-service-a
    ports:
      - "8081:8080"
    restart: always
    links:      - service-b      - service-c    environment:
      - "spring.profiles.active=prod"      - "serviceb.url=http://service-b:8082"      - "servicec.url=http://service-c:8083"    networks:
      - backend

  # Service B
  service-b:
    image: $DOCKER_USER_NAME$/spring-multi-module-service-service-b
    ports:
      - "8082:8080"
    restart: always
    environment:
      - "spring.profiles.active=prod"    networks: 
      - backend

  # Service C
  service-c:
    image: $DOCKER_USER_NAME$/spring-multi-module-service-service-c
    ports:
      - "8083:8080"
    restart: always
    environment:
      - "spring.profiles.active=prod"    networks:
      - backend

# Networks to be created to facilitate communication between containers
networks:
  backend:

As observed, For Service A to access downstream APIs Service B & Service C, links is configured for service-a and the name of the services service-b & service-c is configured for serviceb.url & servicec.url which will ensure HTTP call to the downstream API is successful.

Run the below docker-compose commands to get the stack upstopstartdown appropriately.

Validate docker-compose file and configuration
$ docker-compose config
Builds, (re)creates, starts, and attaches to containers for a service.
$ docker-compose up -d
Lists containers
$ docker-compose ps
Stops running containers without removing them
$ docker-compose stop
Starts existing containers for a service
$ docker-compose start
Stops containers and removes containers, networks, volumes, and images created by - up
$ docker-compose down

Deploying with Kubernetes

Docker Desktop is the easiest way to run Kubernetes on your windows machine. It gives ua a fully certified Kubernetes cluster and manages all the components for us.

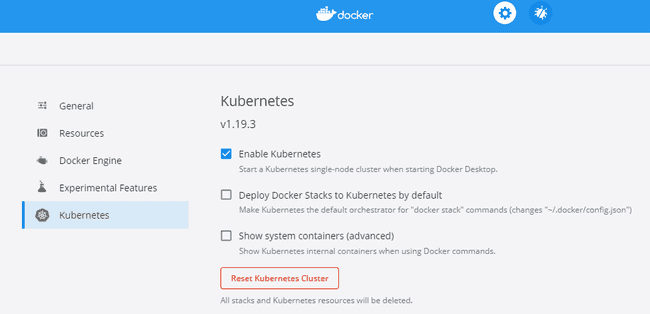
Install Docker Desktop and ensure to enable kubernetes from settings window.

"Enable Kubernetes from Docker Desktop settings tab"
Enable Kubernetes from Docker Desktop settings tab

Execute $ kubectl cluster-info to verify if Kubernetes cluster is running successfully. If not, uninstall and install Docker Desktop and ensure you receive the below message as expected to proceed with kubernetes deployment.

Verify if kubernetes is running
$  kubectl cluster-info

Kubernetes master is running at https://kubernetes.docker.internal:6443
KubeDNS is running at https://kubernetes.docker.internal:6443/api/v1/namespaces/kube-system/services/kube-dns:dns/proxy

To deploy docker images to kubernetes, we need to configure Deployment and Service objects and have them applied to orchestrate the deployment into kubernetes cluster.

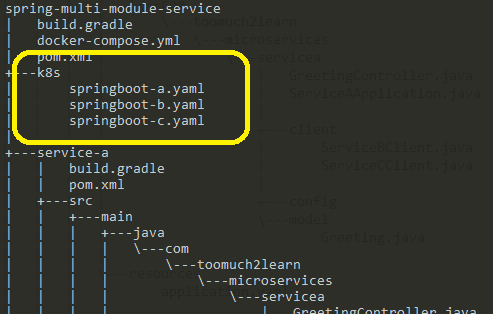
Deployment configuration files are created for services in individual yaml file under k8s folder.

"K8s configuration files"
K8s configuration files

Below is the sample deployment & service configuration for Service A to deploy to kubernetes.

service-a.yaml
apiVersion: apps/v1
kind: Deployment
metadata:
  name: springboot-service-a
spec:
  replicas: 1
  selector:
    matchLabels:
      app: springboot-service-a
  template:
    metadata:
      labels:
        app: springboot-service-a
    spec:
      containers:
        - name: app
          image: $DOCKER_USER_NAME$/spring-multi-module-service-service-a
          ports:
            - containerPort: 8080
          imagePullPolicy: Always
          env:            - name: spring.profiles.active              value: "prod"            - name: serviceb.url              value: "http://$(SPRINGBOOT_SERVICE_B_SVC_SERVICE_HOST):8080"            - name: servicec.url              value: "http://$(SPRINGBOOT_SERVICE_C_SVC_SERVICE_HOST):8080"---
apiVersion: v1
kind: Service
metadata:
  name: springboot-service-a-svcspec:
  selector:
    app: springboot-service-a
  ports:
    - port: 8080
      targetPort: 8080
  type: LoadBalancer

As observed, Service A deployment is configured with environment variables to set spring.profiles.active to prod.

To communicate with downstream APIs, we need to pass serviceb.url & servicec.url with host & port details of Service B and Service C. For this to work, we need to configure the environment variable that are created when services are created. One of them is SPRINGBOOT_SERVICE_B_SVC_SERVICE_HOST.

Passing $(SPRINGBOOT_SERVICE_B_SVC_SERVICE_HOST) will expand the environment variable with host of Service B and set to serviceb.url.

Run the below kubectl commands to deploy or delete the stack.

Apply deployments and services
$ kubectl apply -f k8s
List deployments, services and pods after applying the change
$ kubectl get all
Watch pods by getting all pods or for a specific app
$ kubectl get pods --watch

$ kubectl get pods -l app=springboot-service-a --watch

Service A is configured with LoadBalancer service. This ensures that when Service A is accessed, the request will be routed to one of the provisioned pod. To test this, we can scale the services up by increasing the replica count. To bring down the services, we can decrease the replica count.

Scale deployment up/down by setting replicas
$ kubectl scale --replicas=3 deployment/springboot-service-a
Get Environment Variables set to the pod
$ kubectl exec <POD_NAME> -- printenv | grep SERVICE
Dump pod logs
$ kubectl logs <POD_NAME>

$ kubectl logs -f <POD_NAME>
Delete pods and services
$ kubectl delete -f k8s

Conclusion

This article is useful for usecase which needs all the services to be bundled as modules under a root project. With the support of configuring multiple modules with Maven and Gradle, it is easy for one to build all the modules with single command and have the stack deployed seamlessly to docker-compose and kubernetes.

For better understanding on microservices, it is always ideal to have more than one Spring Boot service implemented.

This article shall be the base for trying out the below concepts with Spring Boot & Spring Cloud.

  • Centralized Configuration
  • Service Discovery
  • Distributed Tracing
  • Fault Tolerance
  • API Gateway
  • And many more…
Clone the source code of the article from mavengradle-based-multi-module-spring-boot-microservices